PowerBI Integration
Power BI is a really good tool to provide self-service analytics with focus on data visualisation. Out of the box Microsoft Dynamics CRM is equipped with powerful charting capabilities. However to connect CRM data with external data, such as finance or ordering system, we usually need to do data warehousing exercise. With the availability of PowerQuery, PowerPivot and PowerView capabilities in Excel we could generate CRM dashboard with self-service filter analysis that merged with external data sources.
Preparing Excel Power View Dashboard
In this example, I will not connect to external data. But solely using the CRM lead data to show the demographics of where is the company’s most strategic places to market and sell. I will start with a basic Excel report that pulling down Lead data from CRM. Open Microsoft Excel with the latest Power Query installed. For installation of Power Query: http://www.microsoft.com/en-us/download/details.aspx?id=39379
Selects Power Query Tab, select the data source From Other Sources > From OData Feed.

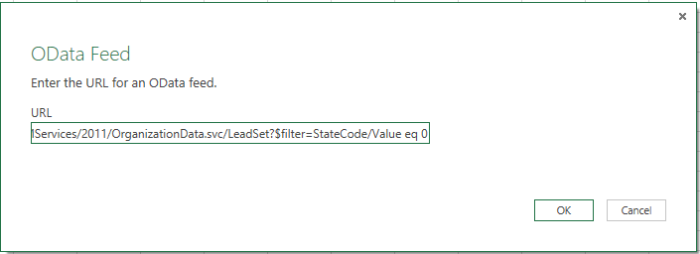
Previously I’ve made a post regarding the tips on only getting the relevant records by applying CRM OData Query in the oData feed here, so for this example, I will retrieve only open Leads:
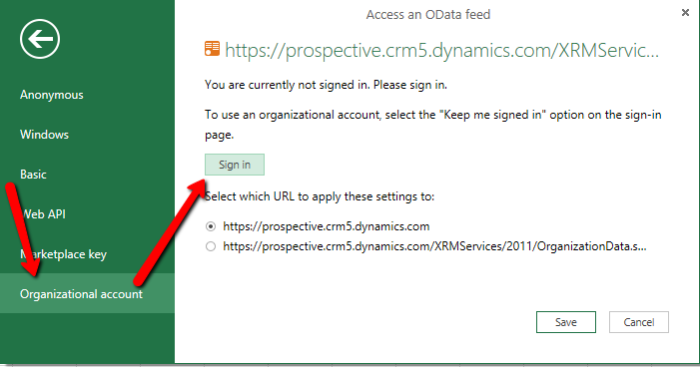
Then it will prompt the account selection, since we are on Office365 account, selects Organizational Account and click on Sign in to sign in with the Office365 account.
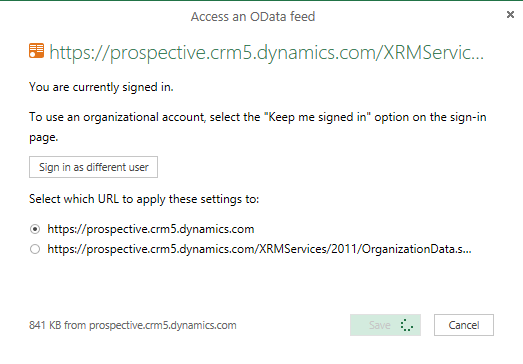
Once signed-in click on save and Power Query will do data retrieval from the CRM Server
Once finished loading the CRM data, it will open up the Power Query Editor similar to:
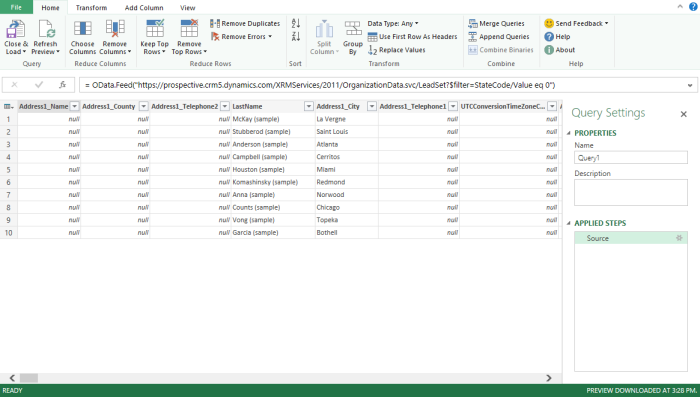
Then click on Choose Columns to select the columns that we care for this report (Full Name, Company Name, Address1_Line1, Address1_City, Address1_PostalCode, Address1_StateOrProvince, Address1_Country and Estimated Amount)
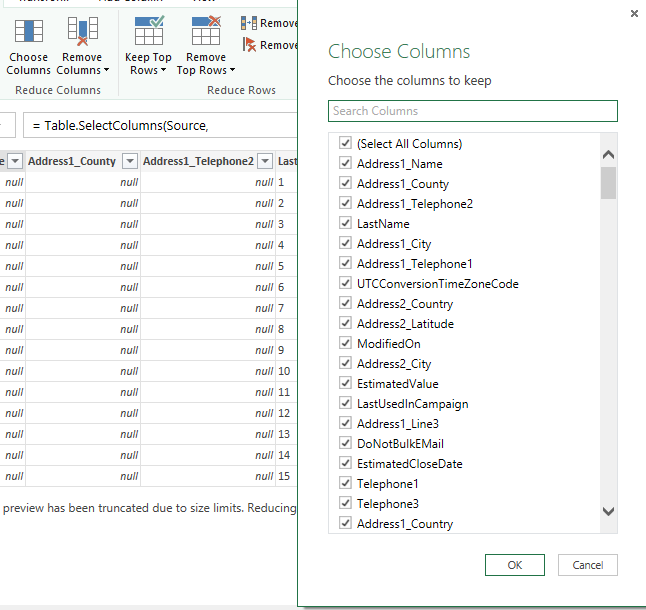
Once the columns selected, we could re-arrange the columns to make the data neat, then click on Close & Load
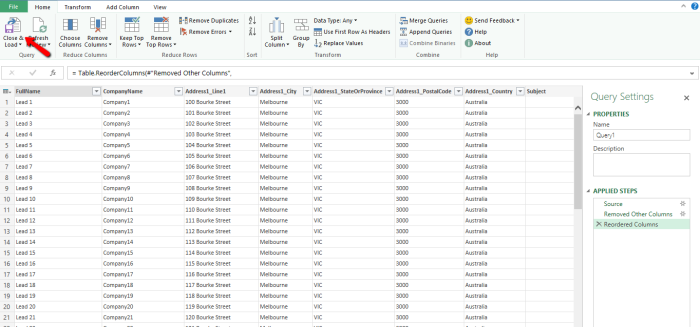
It will load the query and pull the data from CRM to the worksheet, it might takes some time for large dataset.

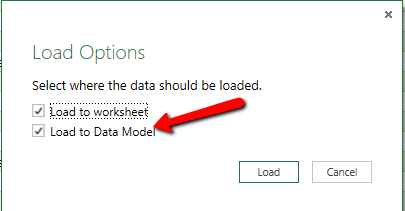
Once loaded, we need to do some Power Pivot exercise to prepare the data model and manage the address fields to be recognised as address related data by right-clicking the Query click on Load to…. Choose both worksheet and Data Model
Once loaded, click the Power Pivot Tab and Click on Manage button

To mark the fields as address data type, click on “Advanced” tab on Power Pivot Select the columns header of the address data (street, city, state, postcode and country) and set the Data Category accordingly.
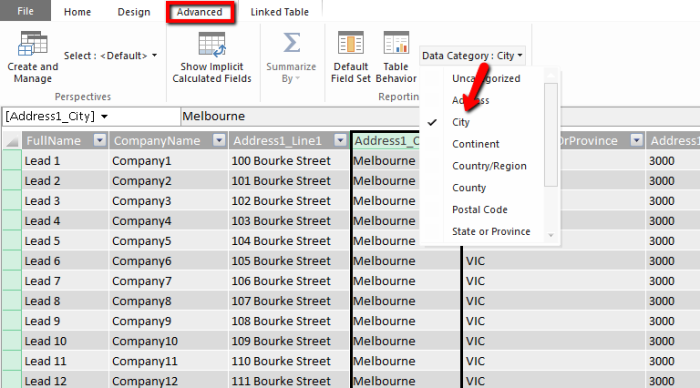
Once set, close the Power Pivot editor. To add the graphical view of this report, click on Insert tab and click on Power View

It will create a basic Power View dashboard similar to:
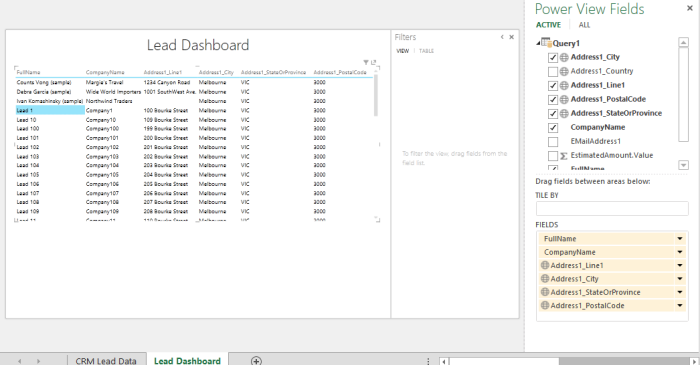
Then we might want to configure the dashboard to show the map and some chart by clicking on the Design tab and might be ended-up to be something like this:
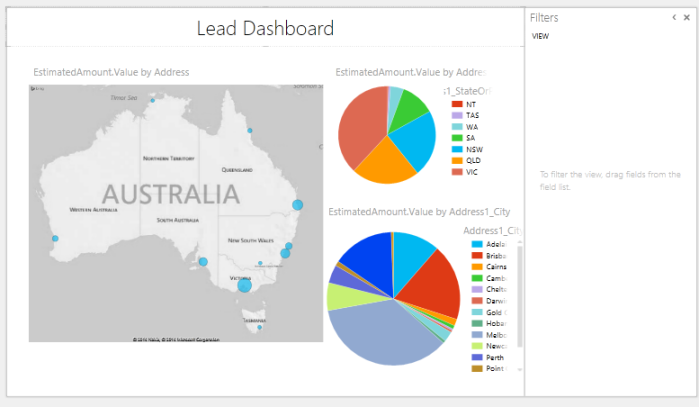
Save this Excel Spreadsheet to be used later on in Power BI site.
Setting Up Power BI Site
Since previously in this example we are adding Power BI subscription from an existing CRM instance on Office365 tenant, the Power BI provisioning might not set up the Power BI SharePoint Site directly. So, I need to either a new site for Power BI or use an existing site. For this trial preparation, I will create a separate site for the Power BI purpose.
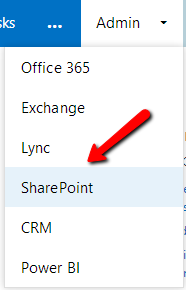
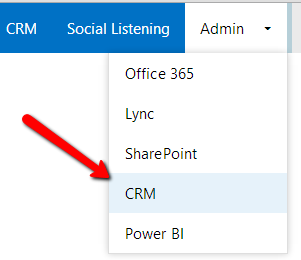
In Office365 admin portal, click on Admin navigation and click on SharePoint.
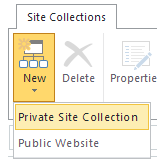
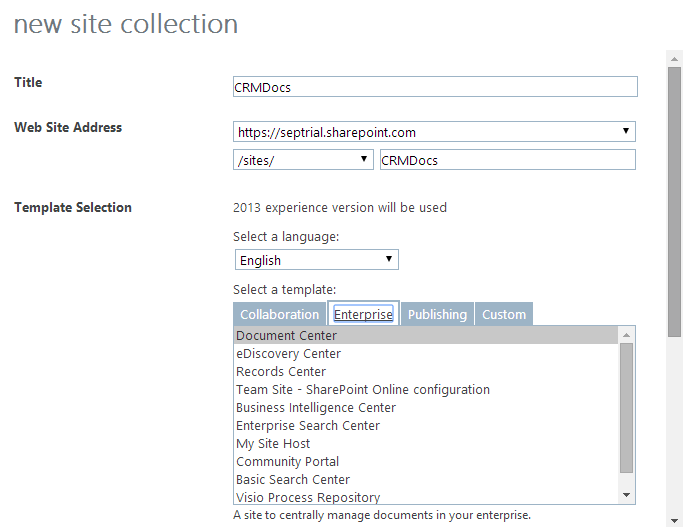
Click on New > Private Site Collection
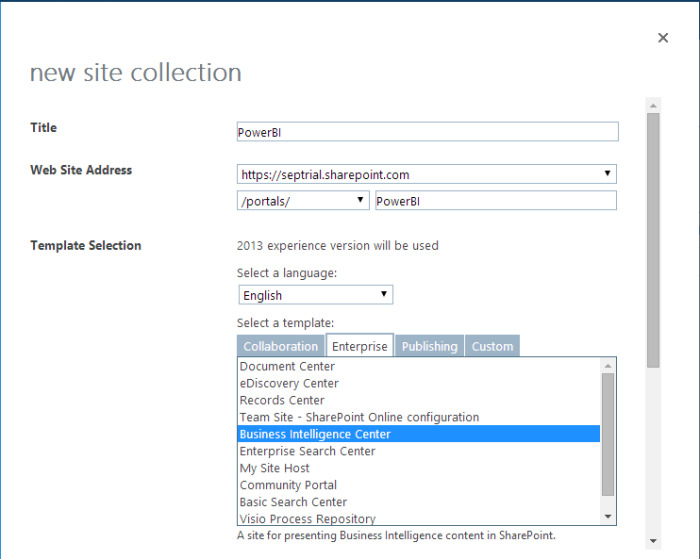
I called the site as PowerBI and use the Business Intelligence Center as the template.
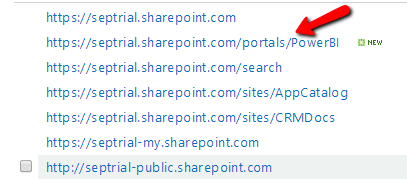
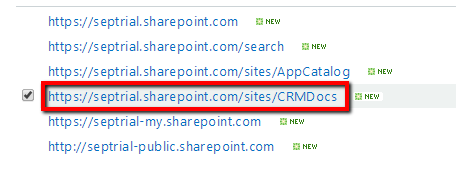
Once the site has been successfully provisioned by SharePoint, go to the site.
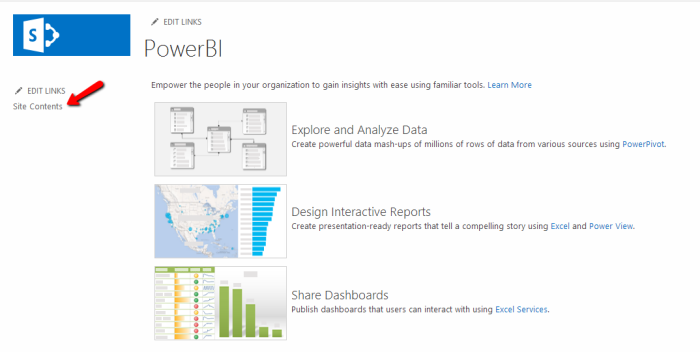
It will Display the default page with some instruction of BI capabilities. To add Power BI functionality to this site, click on Site Contents at the left hand side navigation.
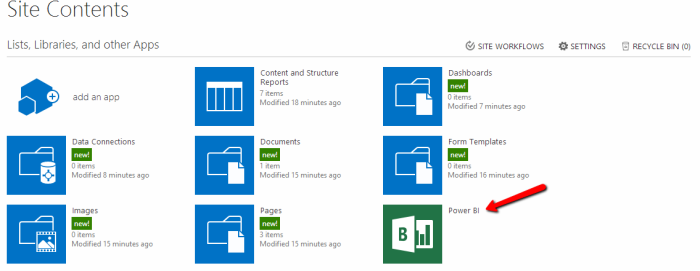
It will show the list of available components and apps to be added, click on Power BI to add Power BI functionality to the SharePoint site.
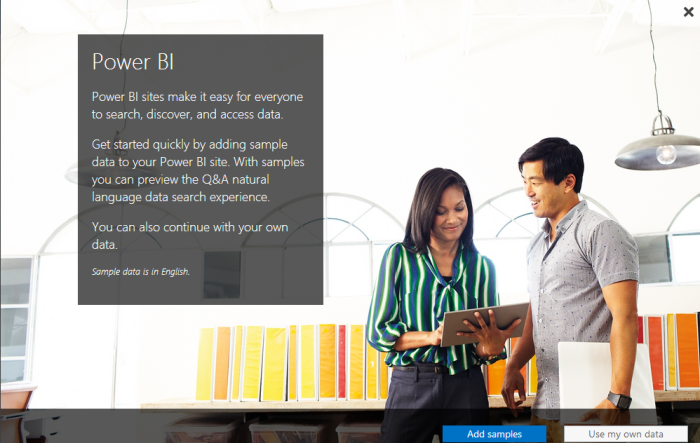
It will then showing this big banner of Power BI, I choose to Use my own data, as I’m going to use the data from CRM.
Then it will close this modal dialog window and show the main features of Power BI (Featured Reports, Dashboards and Data Connections)
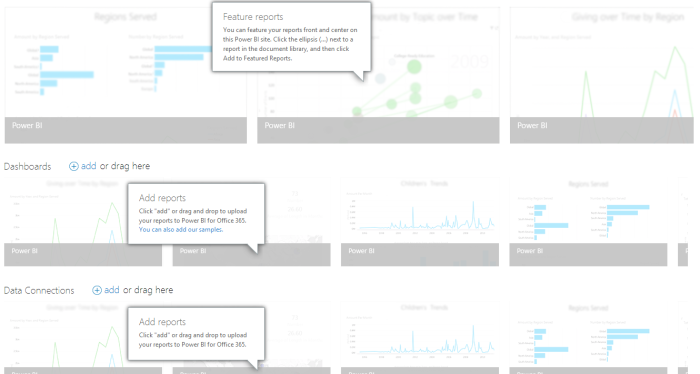
On Dashboards, click on (+ add) or drag the Excel Power View Report that we create previously.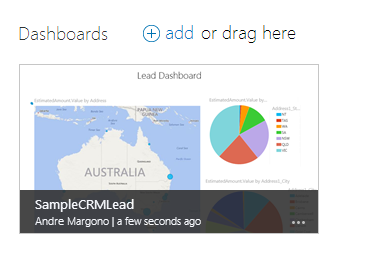
Once uploaded, click on the tile to view the dashboard. Copy and keep the URL of this page to be used later in CRM Dashboard iFrame setup, the URL will be similar to: https://septrial.sharepoint.com/portals/PowerBI/_layouts/15/WopiFrame.aspx?action=embedview&sourcedoc=%7b85c0bf22-01a7-400e-91f3-ae91b174e110%7d
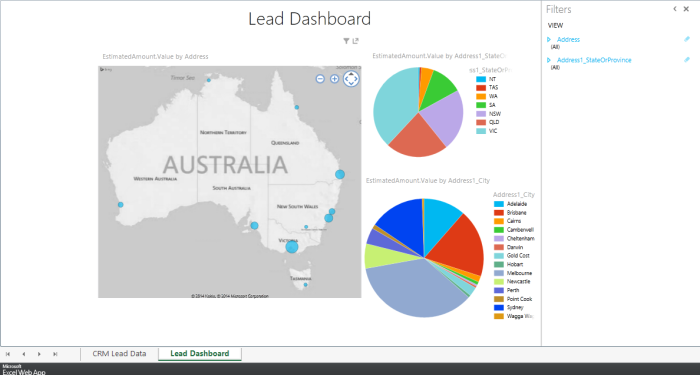
One of the coolest feature of Power BI is to set data refresh. Click on … at the bottom right of the dashboard tile to schedule the data refresh.
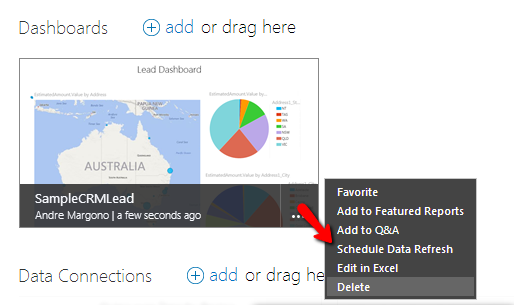
The refresh schedule provides intuitive scheduling functionality for us to schedule data refresh:
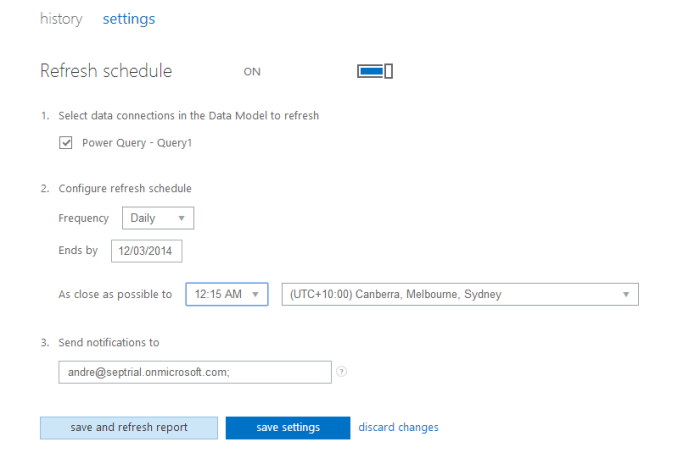
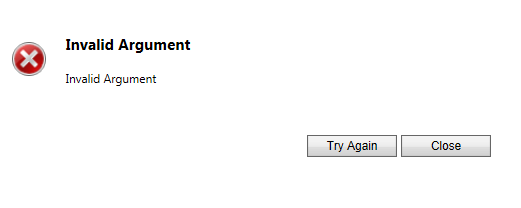
Edit: Based on the list of external data that currently supported, it seems scheduled refresh for data from CRM Online is not supported yet. So, I think this is a feature that would be nice to be supported soon. It will resulting into an error of data refresh like:

Ref: http://office.microsoft.com/en-us/office365-sharepoint-online-enterprise-help/use-external-data-in-workbooks-in-sharepoint-online-HA104054001.aspx
CRM Dashboard Setup
To get the Power BI Report to be shown in CRM’s Dashboard we could not use Personal Dashboard and we need to use System Dashboard due to iFrame Cross-Frame Scripting limitation on personal dashboard.
So, for this example, I created a brand new Solution called “Power BI Dashboard” and create new Dashboard and named it as “Lead Dashboard”
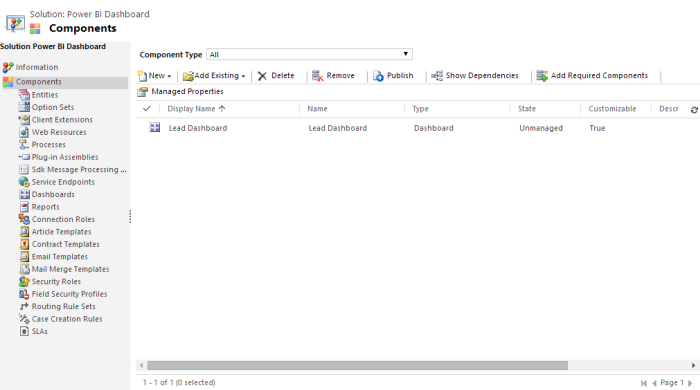
In this Dashboard, I added an iFrame component. Important: uncheck the cross frame scripting to ensure the dashboard works properly.

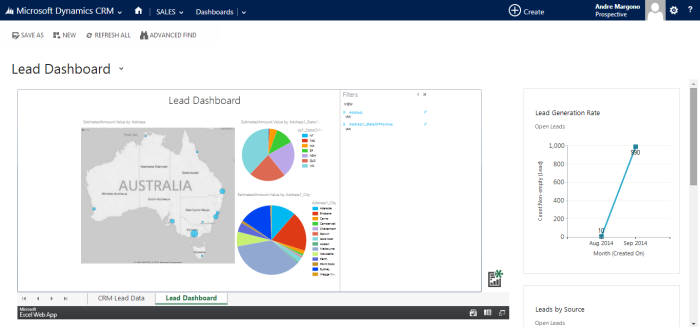
And then add a couple CRM charts and views to completely assemble a simple Lead Dashboard in CRM that integrated with Power BI:
Conclusion
Setting up Dynamics CRM with other Microsoft stacks on the cloud (Friends), is so much easier than deploying each individual components On-Premise. This whole example setup can be completed in a small number of hours to setup, where if these setup took place On-Premise it could take a couple of days of effort to setup. A big thanks to Microsoft cloud services, especially the CRM Online and Office365 team to keep improving the experience in their cloud services provisioning.
Special thanks for Sarah Ashton to provide the feedback before I posted this series 🙂
The whole series of “Preparing CRM Online + SharePoint + Exchange + Power BI Trial”:


































You must be logged in to post a comment.