IE Developer Tool – Minified JavaScript – Make it Neat!

Recently I’m working on a web application and need to debug a 3rd party solution. The javascript file is minified to make it efficient in loading speed as the smaller size is less data that need to be transferred. 

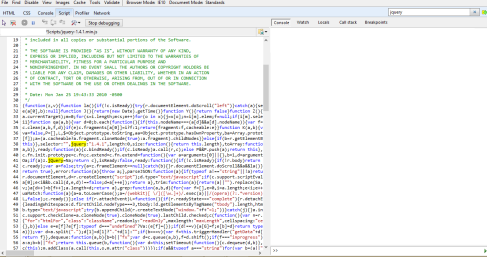
When I’m debugging this javascript file, I debugged using IE developer tool (for whatever reason, this is my favorite debugging tool, even I still using firebug and Chrome’s dev tool). However, how could I possibly read this whole gibberish javascript file?? (for example I used jquery.min.js)

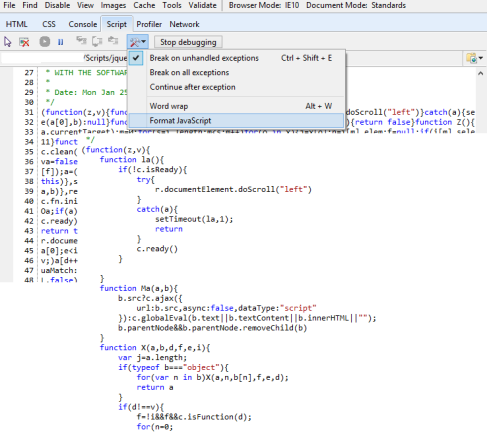
It’s really frustrating isn’t it? As curious as anytime, I clicked everywhere on the toolbar to make the script neater. And I found this amazing Format Javascript option, and this is the result:


Why this option not turned on by default? I don’t know, but now I can read the javascript file, at least to debug it.



Usefulness of WCF Tracing

Today I got some “unhelpful” exception while upgrading one of the project from CRM 4 to 2011. And the structure of the project is changed from using direct communication from website to CRM, now it utilize WCF in between.

I’ve been doing WCF for about 2 year, but now I just found out that WCF tracing can be this useful. So, this is what happened:

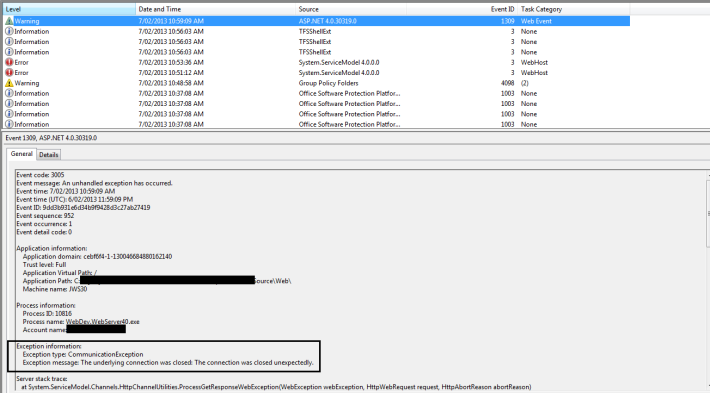
No clear explanation right?

Then I decided to trace and add this in web.config of WCF:

<system.diagnostics><sources>  <source name="System.ServiceModel" switchValue="Information, ActivityTracing" propagateActivity="true"><listeners>  <add name="traceListener" type="System.Diagnostics.XmlWriterTraceListener" initializeData= "c:\traces.svclog" /></listeners>  </source></sources>  </system.diagnostics>

Do the problematic process again, and it generates:

I opened it, skim through the log and found this:

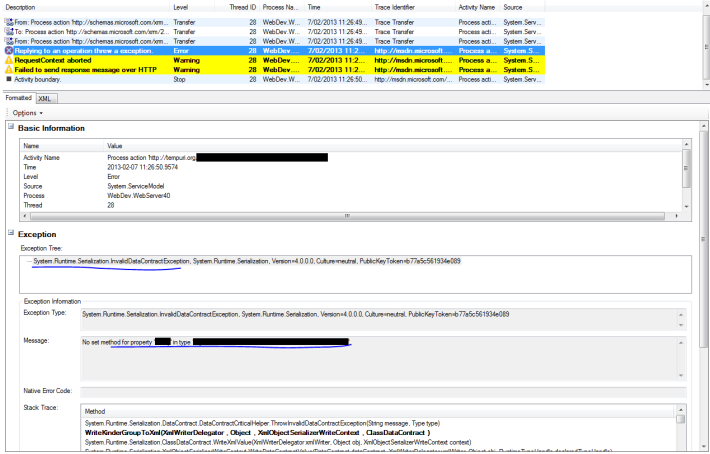
Double click that one, something goes wrong..

Select that error:

Gotcha! Now I have better clue on what I should fix..